
Infographics had been famous around the web for its ability to relay information in a truly artistic manner. This makes it a universal language for it can tell a story even with one look at the visual representations. We can say that they do not have limits and boundaries for they speak through visuals. The use of graphics gives an added beauty to the entire material. It is even made more significant with the use of valuable data that will be delivered to the public.
When you use visuals to represent information, you are creating an information graphics. This is most commonly known as infographics. You can find it around the web now containing different kinds of information. Aside from the facts and figures, what makes it more impressive are the colorful graphics and smart manner of giving knowledge to people. For designers, we have here some tips to help you design effective infographics. Read now so you will be guided.
1. Focus on a single topic.
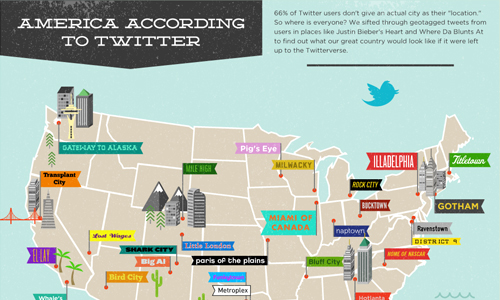
Image: inboxq
First thing to consider is to have a single topic for an infographic. You will have an effective output if you will try to give answers to a single question. You can create clearer visualizations if you know where you are going to. This will also avoid confusion for your readers and viewers. After determining your topic, determine a particular question that you want to be answered in your infographics.
2. Keep it simple.

Image: princeton
Since you are creating something to convey a message, you have to make sure that it is not over designed that it makes the information complicated. You need to keep it simple in order not to confuse the readers and viewers. An over-complicated visual will not be effective and might even cause misinterpretation. Also, if it is too crowded, it might not attract the viewers but drive them away.
3. Data is important.
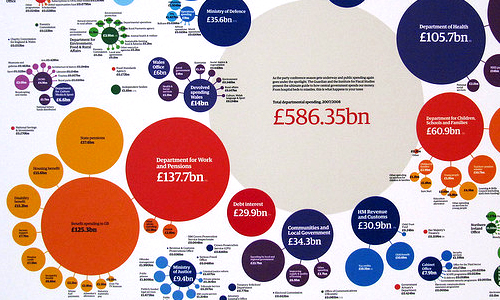
Image: Tripu
The real reason why you are creating an infographics is to give information about a particular topic or issue. So, in creating it, do not forget that it is the most important thing. Do not overdo the design to the extent that it will dissolve the information. You have to make sure that your design will give clear emphasis to the facts and figures.
4. Be sure facts are correct.
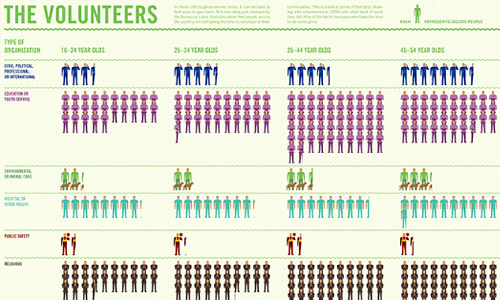
Image: awesome.good
It is important to make sure that your data is correct. If not, this will decrease the credibility of your infographics. So before you make it, be sure your facts are right. Research well and use the right information. Remember that your aim is to give information. So, it has to be right. Never forget to proofread your output and check the facts.
5. Let it tell a story.
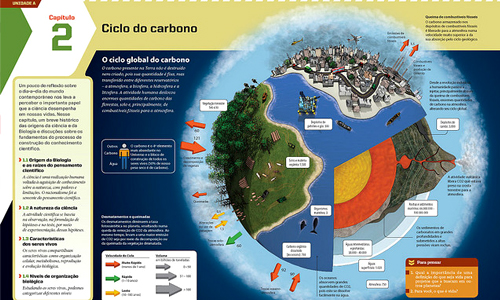
Image: Gerson Mora
An effective infographics can manage to tell a story with the illustrations and graphics. It should be able to say something so that it can relay the information even if they haven’t read the text yet.
6. Good design is effective.

Image: dailyinfographic
If we speak of visuals, a good design will always hit the mark. No matter how simple your infographics is, use your creativity to make the design appealing. When we speak of design, colors, type, layout and the use of white space matters. People would stare longer to an infographic which has a good design.
7. Choose attractive colors.
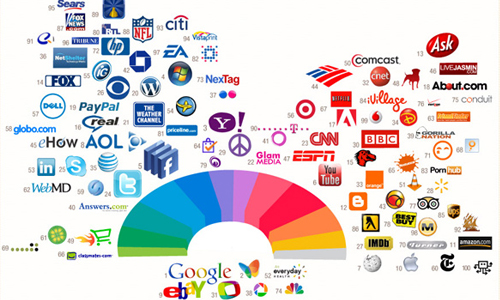
Image: colourlovers
Colors are vital. Choose those which can give a great impact to the viewers. Take note of color psychology, too. Use the right colors that fit the topic you will create an infographic for. But it doesn’t necessarily need to be colorful. Some infographics use only few colors but are still effective.
8. Use short texts.
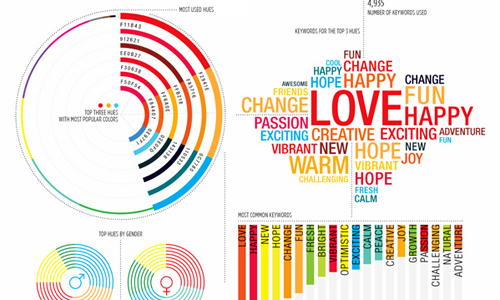
Image: colourlovers
You are creating a visual presentation so you need to use brief texts that are direct to the point. These could be labels or short messages that can support your visuals. To make the story compelling, it is better to use words in minimum number. You also have to choose the right font type that is readable.
9. Check your numbers.
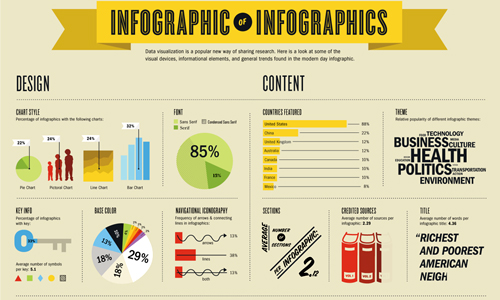
Image: thenextweb
If you are presenting numbers through graphs or charts, see to it that these numbers are right and your illustration is also right. You should know which number to use and which number could not be included. This way, your infographics will be more effective and less confusing.
10. Make the file size small.
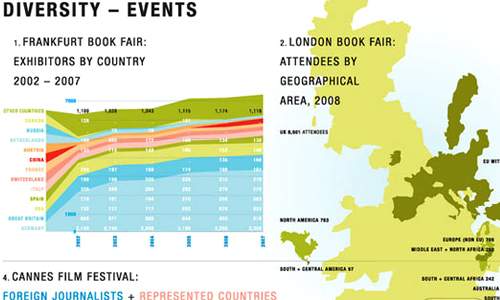
Image: Jonobr1
Having a small file size makes it easier for people to download your infographics and use it for good purposes. This downloads fast and can also eat up a small part of your flash drives in transferring the files. You can even easily attach them to your e-mails and send it to others. But do not sacrifice the quality of your image. It should always have high quality so that it could have a better impact to the viewers.
It’s Your Turn Now
Content delivery is surely made successful with the use of infographics. It doesn’t only make info vital but it makes it look more exciting, easily to understand and even interactive. For sure, even those who get bored with information will be attracted to take a look at it and read the contents. This is indeed an effective way to get the attention of people from all ages. If you are creating infographics, take note of the tips we have given above so that you will be guided in designing it. But if you have other tips to add to this list, we would love to hear that from you. Please feel free to leave a comment below.


Wow! This is another post i have been waiting for! Infographics info.. 🙂 Thanks Marvi!
I agree with number 8.
Very important post, Point No 6 is most important. I have seen several times that good visual & design get good hit.
I have to agree with you. 🙂